Loading data ...
No data is available for the selected filters. Please adjust your filter settings.

Country Name

Country Name

National Risk Adaptation:

Government's Risk Management Effectiveness:

Average
Your browser does not support one or multiple features required by this application. Please visit this application with a recent browser (IE ≥ 9, Chrome, Firefox).
The Global Risks Landscape shows how survey respondents rated, on a scale of one to five, 50 global risks in terms of both likelihood and impact over the next 10 years if they were to occur.

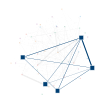
Click on the dots to learn more about the individual risks. Use the filters to see how risk perceptions vary between different sub-sets of the sample.

In the survey, respondents were asked to choose pairs of risks that they believe were highly connected. The Risk Interconnection Map is a network diagram depicting all these interconnections. The darker the line, the more people chose that particular pair of risks. This diagram is intended to stimulate thinking around scenarios of co-occurring risks, and to highlight the need for inter-disciplinary, multi-stakeholder risk management solutions.

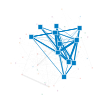
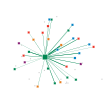
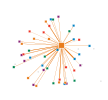
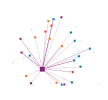
Click on the dots to learn more about the individual risks, and their connections.
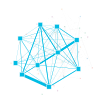
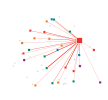
Click on the icons above to see the constellations that have been discussed in the case chapters of the Global Risks 2013 report, or the risks that survey respondents identified as Centres of Gravity - the risks that they believe have the highest systemic importance.

This list shows all 50 global risks that are covered in the Global Risks 2013 report. These were identified by Forum researchers together with leading experts from the World Economic Forum's communities as the most pressing risks that threaten the world over the next 10 years. These are risks that affect different regions, organisations and sectors of society simultaneously, and thus require multi-stakeholder solutions.

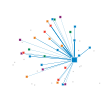
Click on the individual risk items to find out more about these risks.

Use the filters to narrow down the list by category.

To measure perceptions of national resilience, new survey questions were introduced in two of the World Economic Forum’s surveys. Click on a country in the above map to see how it was rated in terms of its ability to recover from and adapt to 50 global risks, as well as how the government’s effectiveness in managing global risks was rated.

Please note that, for the first question, the sample size varies significantly between countries. To better judge the quality of the data, the 95%-confidence intervals are displayed, and in cases where that exceeds one unit on the measurement scale, the countries have been shaded in the map.

To learn more about the Risk Response Network’s work on national resilience, read the Special Report chapter in the Global Risks 2013 Report.